<TAGS>
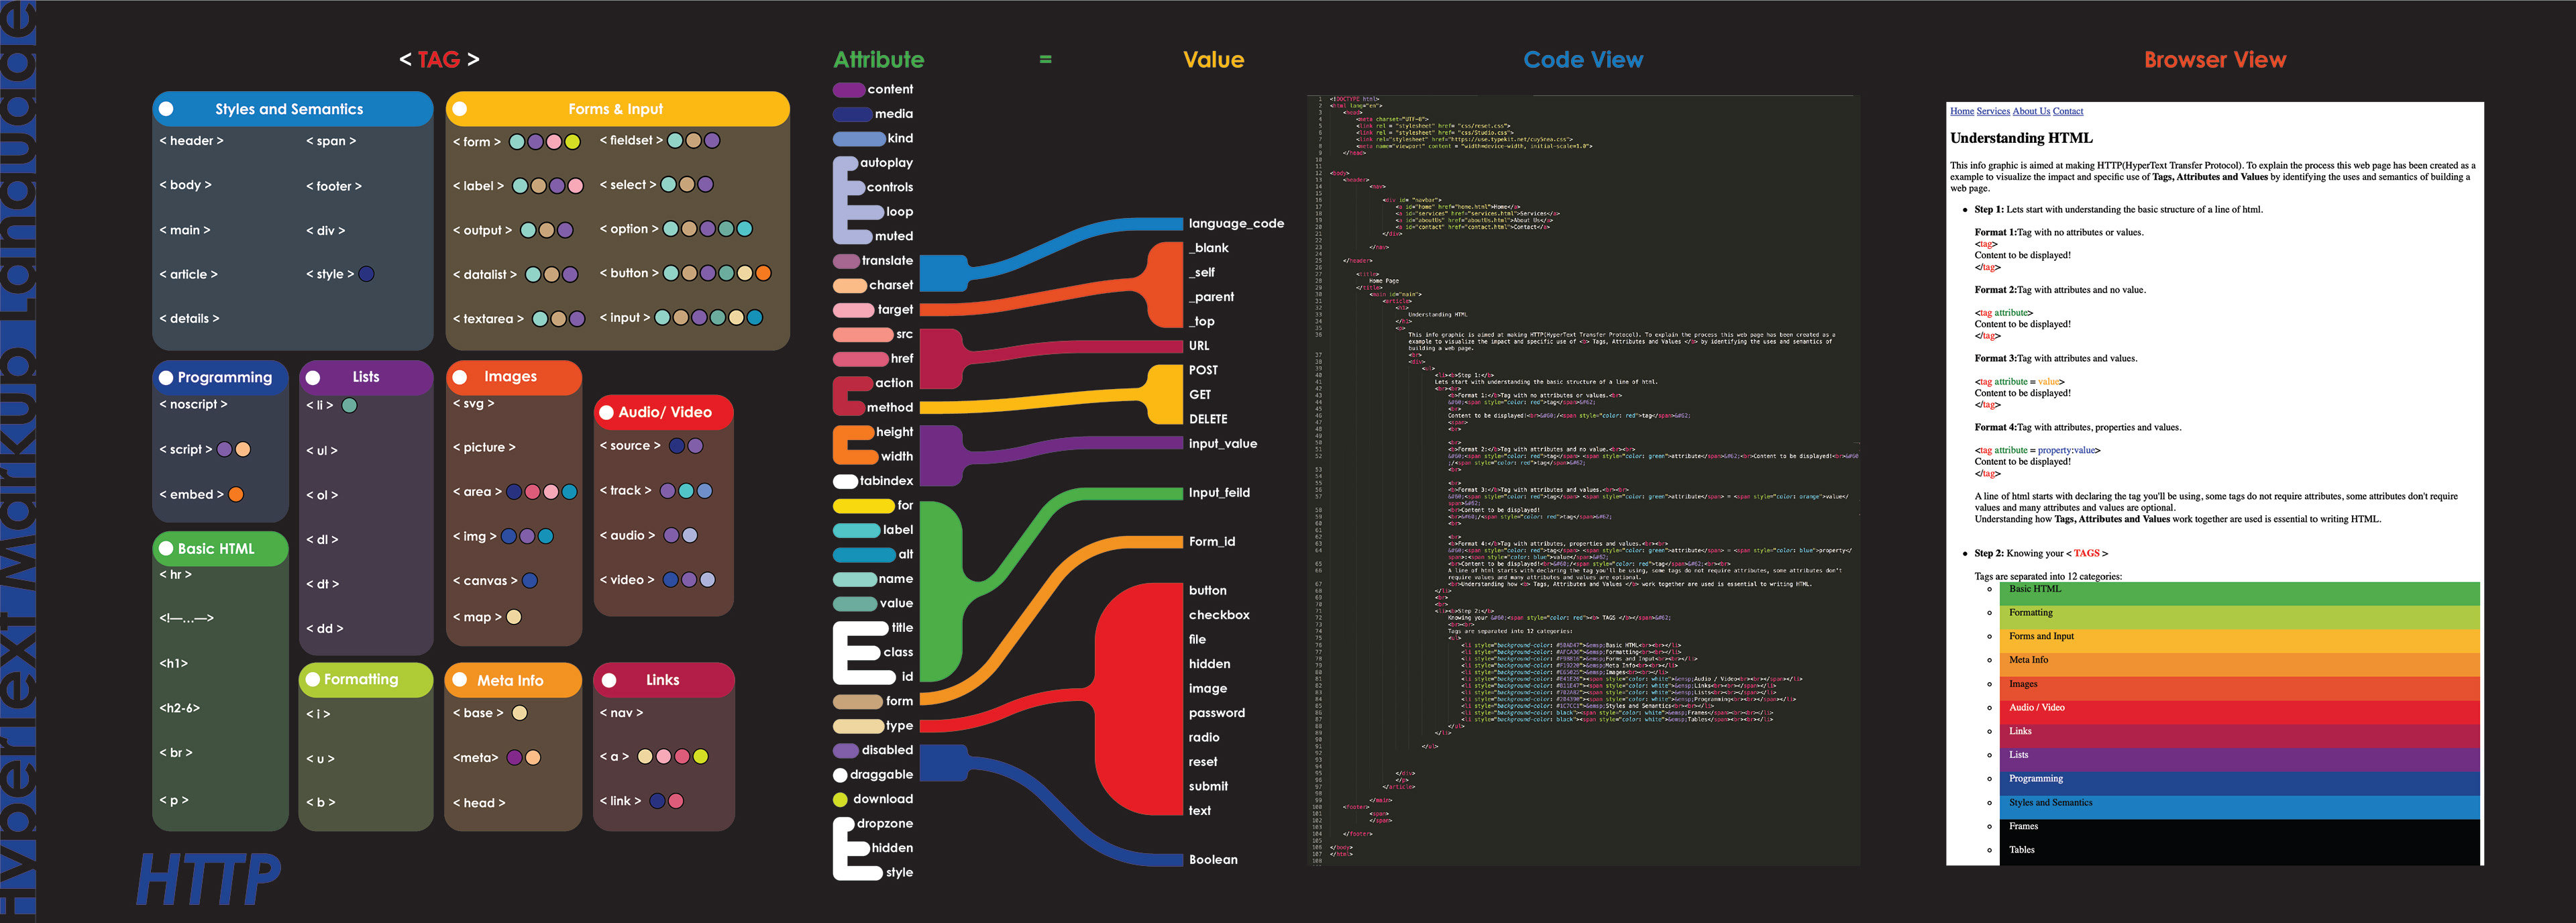
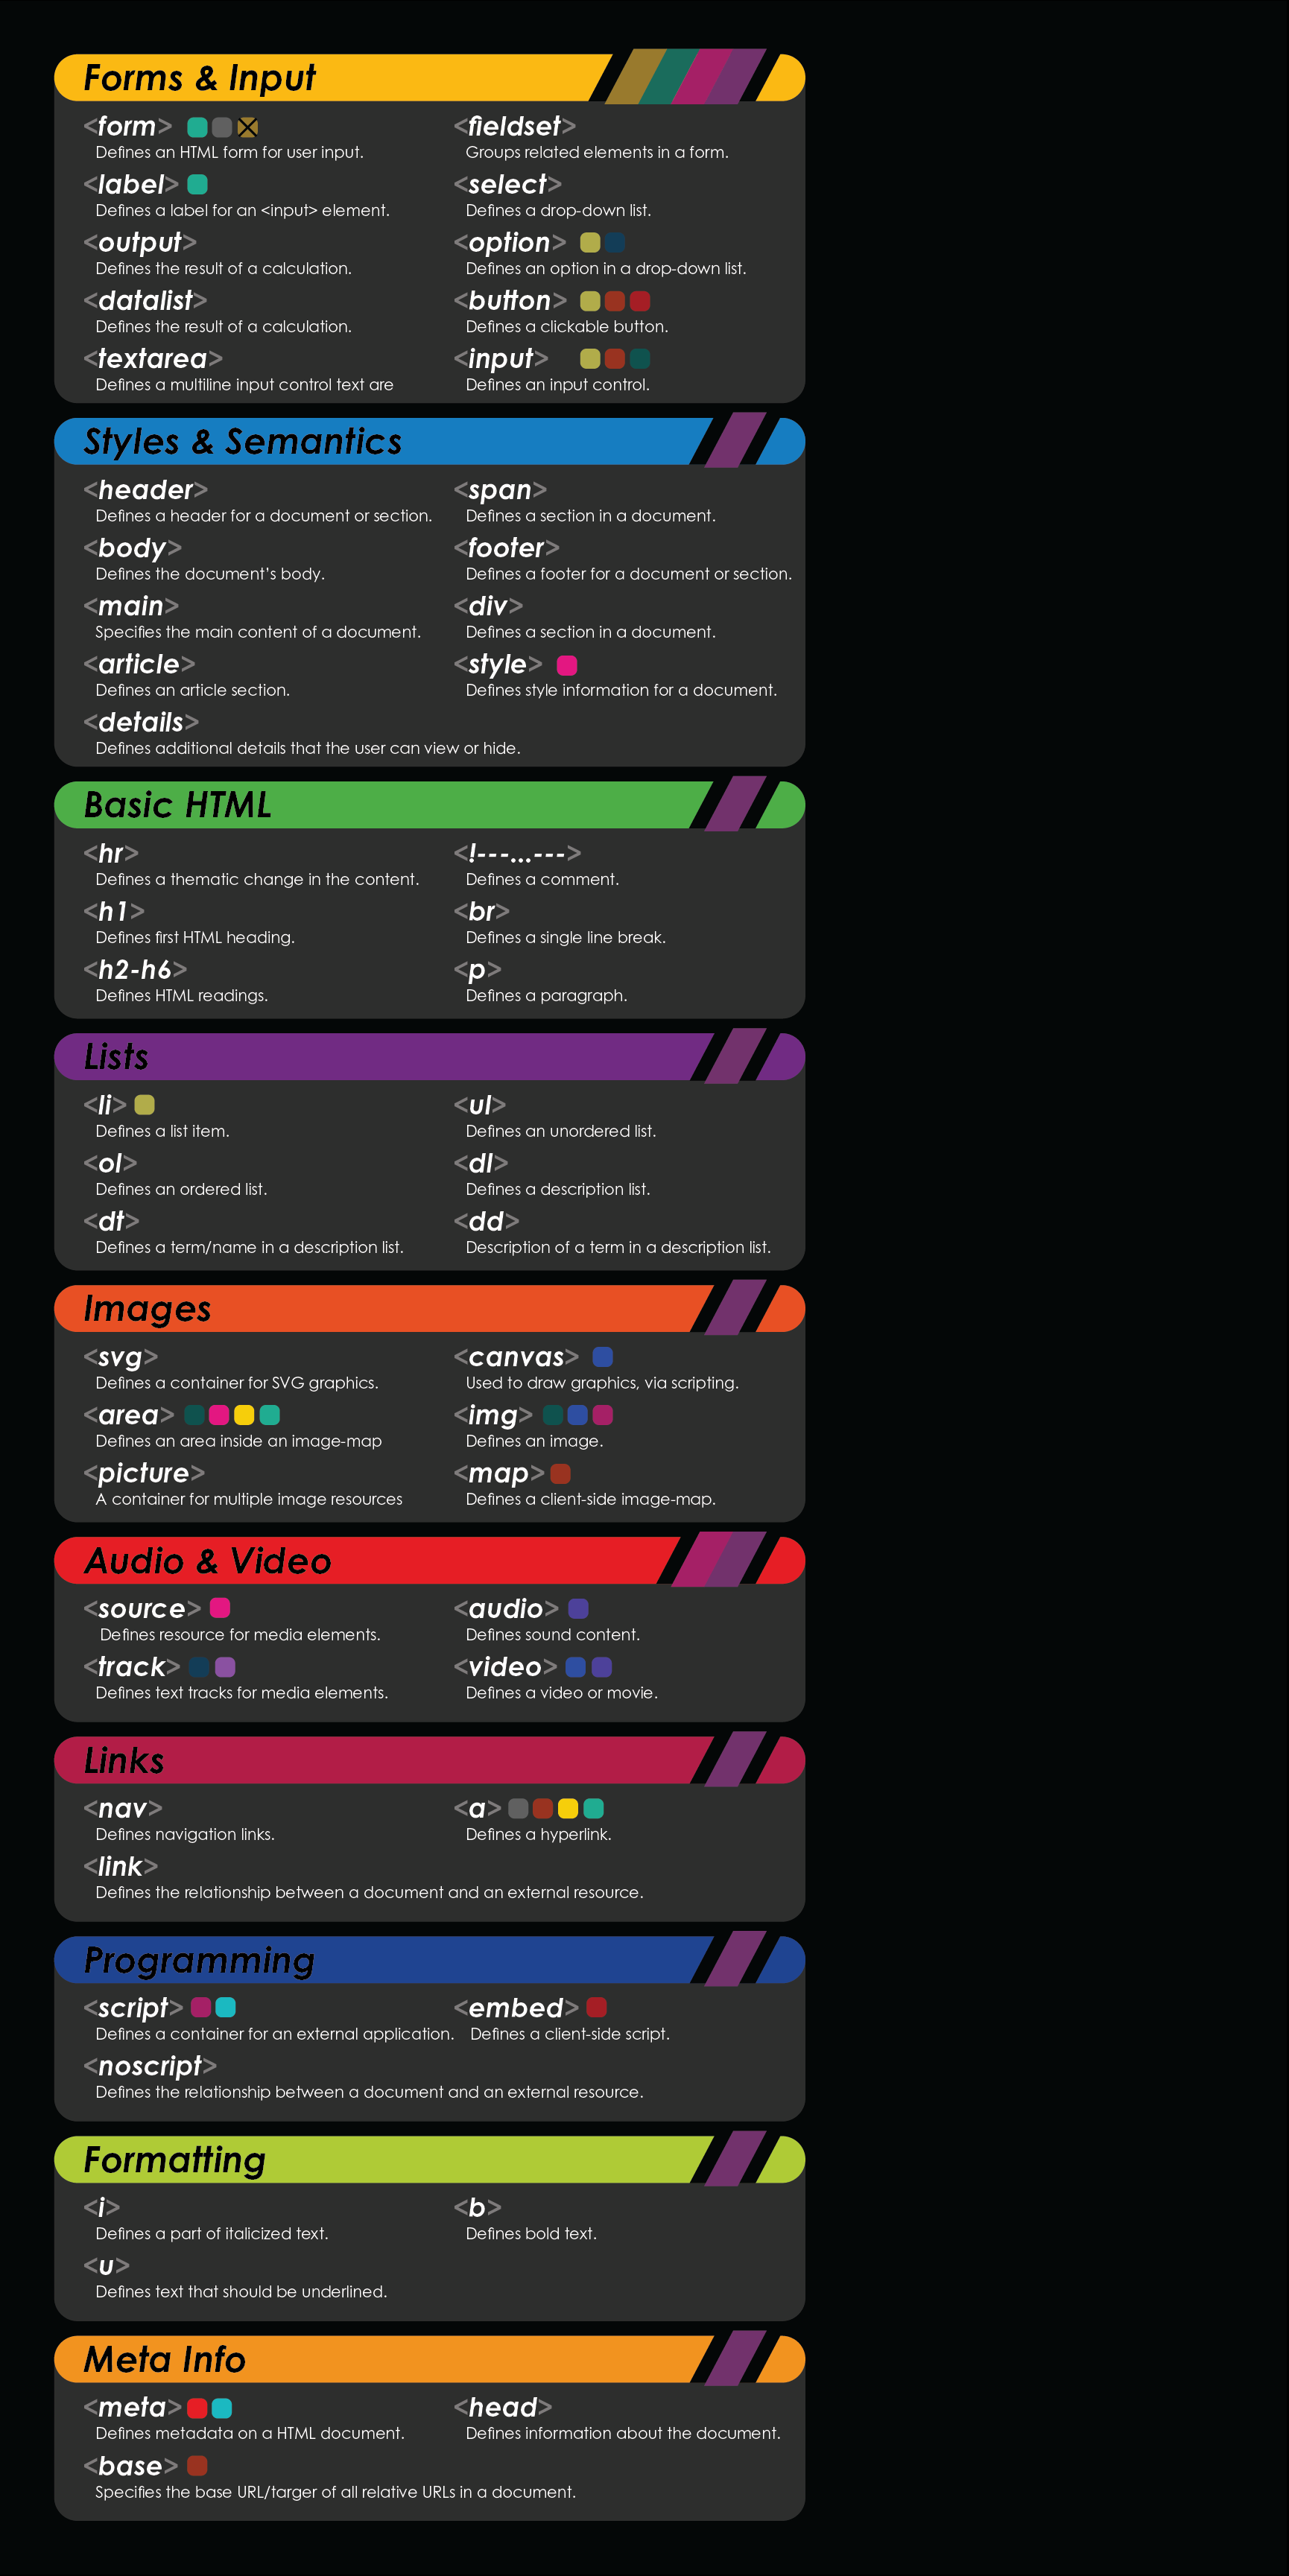
The First element of this infographic is focused on grouping the tags used in HTML by color, this grouping is done by the type of tag. Their are 10 types of tags that are used in HTML programming:
Styles & Semantics
Tags that label areas of the HTML document, they build the skeleton of the website and section/ group areas together.
Basic HTML
Used for creating text using headings or paragraph styles, allowing for things such as line breaks, comments, and horizontal rules.
Forms & Input
Primarily used for user inputs and data collection, allow for an interactive web page that can store information in databases.
Programming
Allows for the implementation of other programming languages to introduce elements such as animation and transitions.
Lists
Used for creating bulleted or numbered lists in HTML documents.
Formatting
Formatting text for bold, underlined, italic, and others.
Images
Uses image maps, place images from folders or webpages, the tag controls what type of images are being placed .svg, .jpg, .png, etc.
Audio/ Video
Used for importing audio or video files, allowing for the element to be played or viewed directly from the webpage.
Meta Info
Used for metadata purposes, and set up of HTML document.
Links
Used for creating linked content.

<...Attributes =...>
The second portion of this infographic uses the colors on the left side of the attributes to relate them to what elements can accept and utilize these attributes. For example, the tag <embed> takes the attributes Height & Width to embed a file at a certain pixel ratio into a webpage.
<... = Values>
Attributes are used almost always with values, sometimes those values are properties with values themselves, however, the structure of the infographic shows what attributes require no value, and what values can be used by certain attributes. getting the format correct is the hard part.
The line of code with a tag, attribute and value displayed below:
<embed height = "40px" width = "60px"> CONTENT </embed>
Grouping + Relationships
By using color and proximity to relate each attribute to the tags they're associated with, a simple direct correlation between tags attributes and values. This is the most confusing portion of learning HTML. This issue of confusion results from the status quo method of extensive documentation on the subject, requiring many clicks before navigating to the page with the information you are looking for. The purpose of this infographic is to simplify this process by placing all the information on a single page and creating intuitive simplistic relationships. This infographic is useful for teaching and reference for HTML programming providing a full-bodied information design.
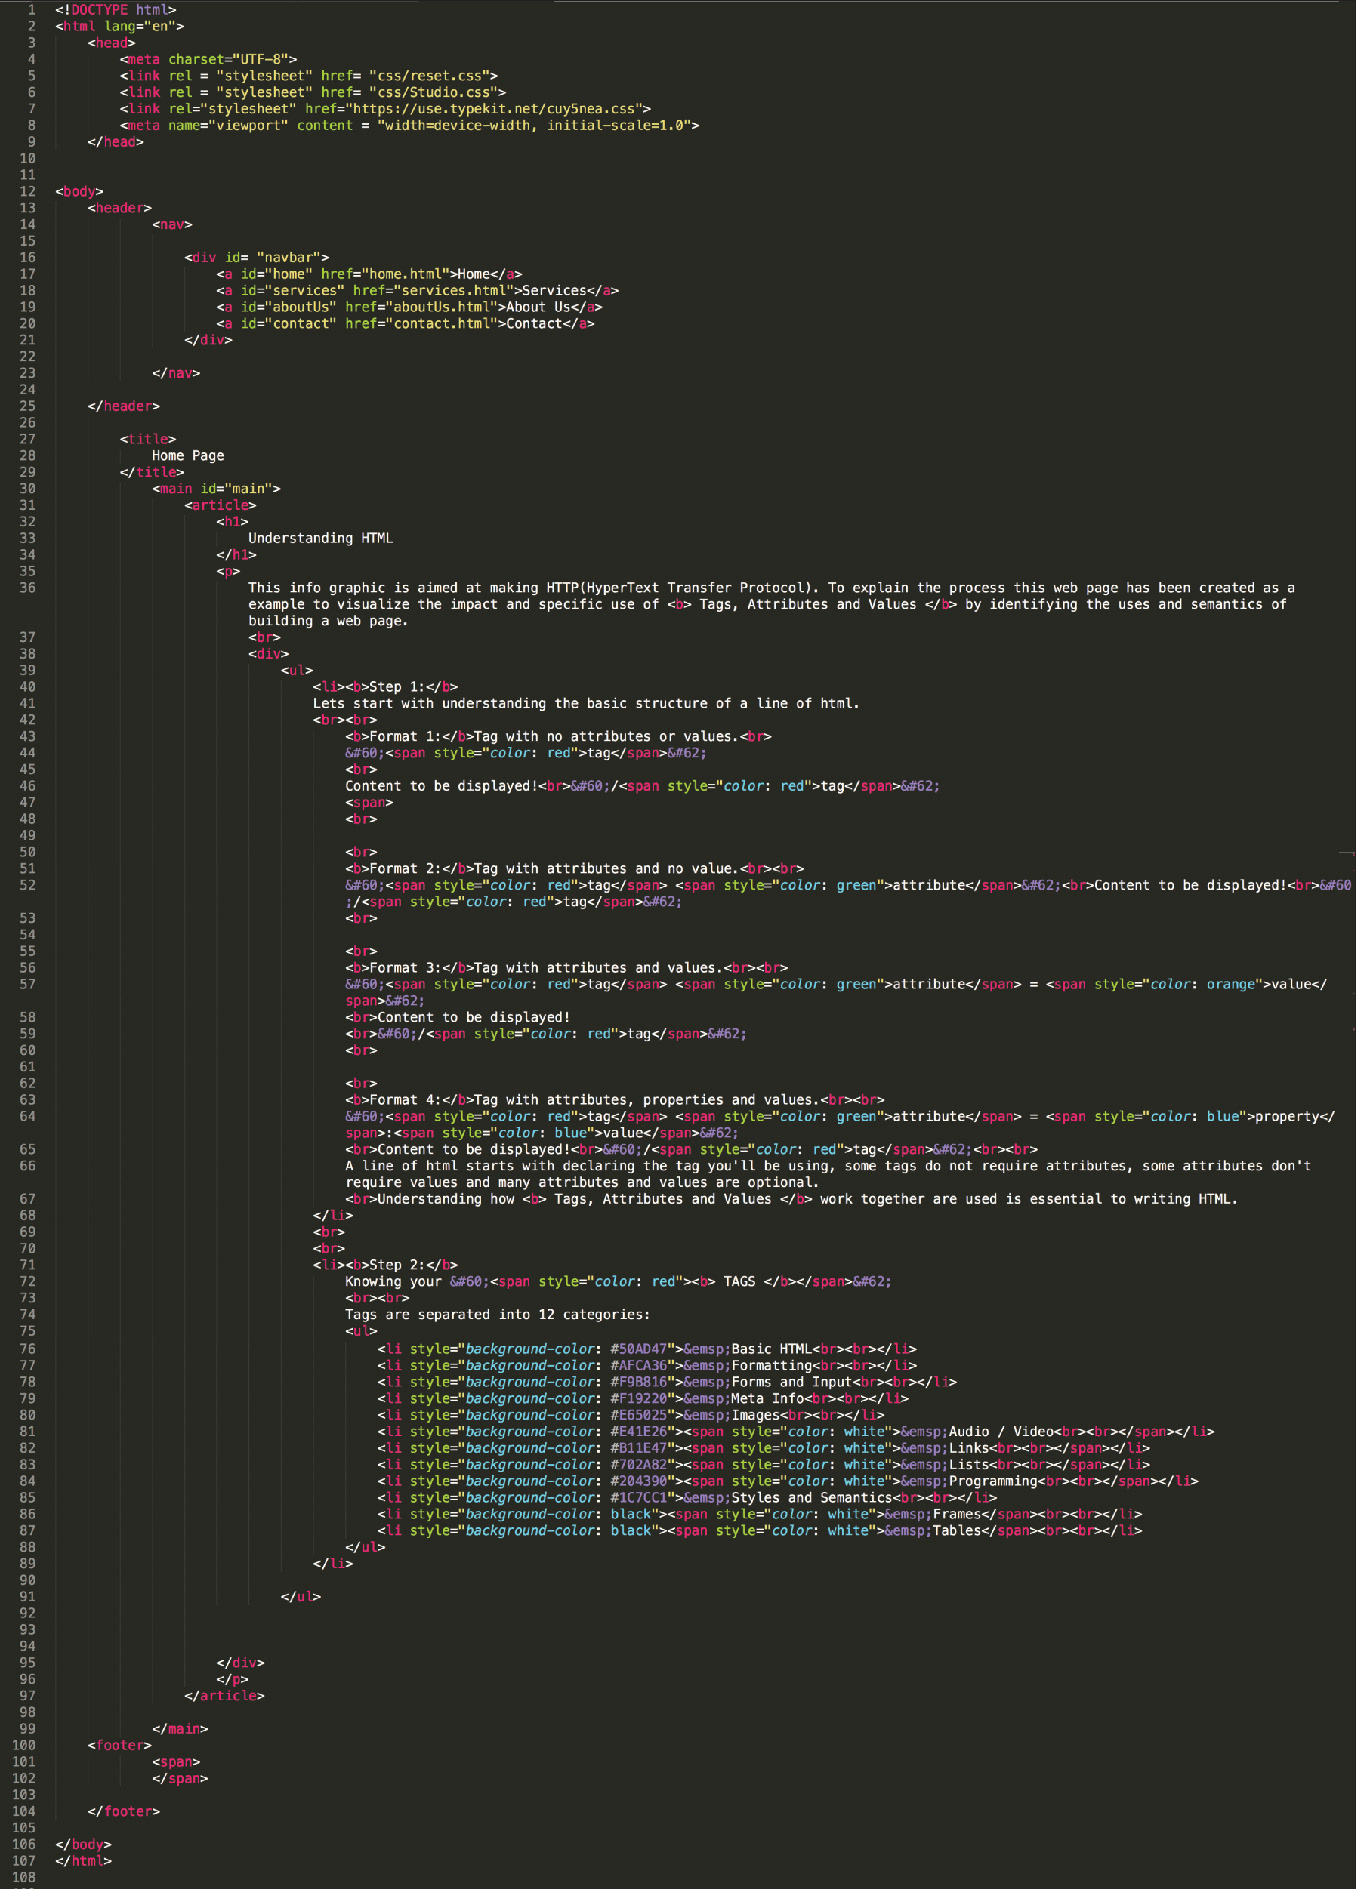
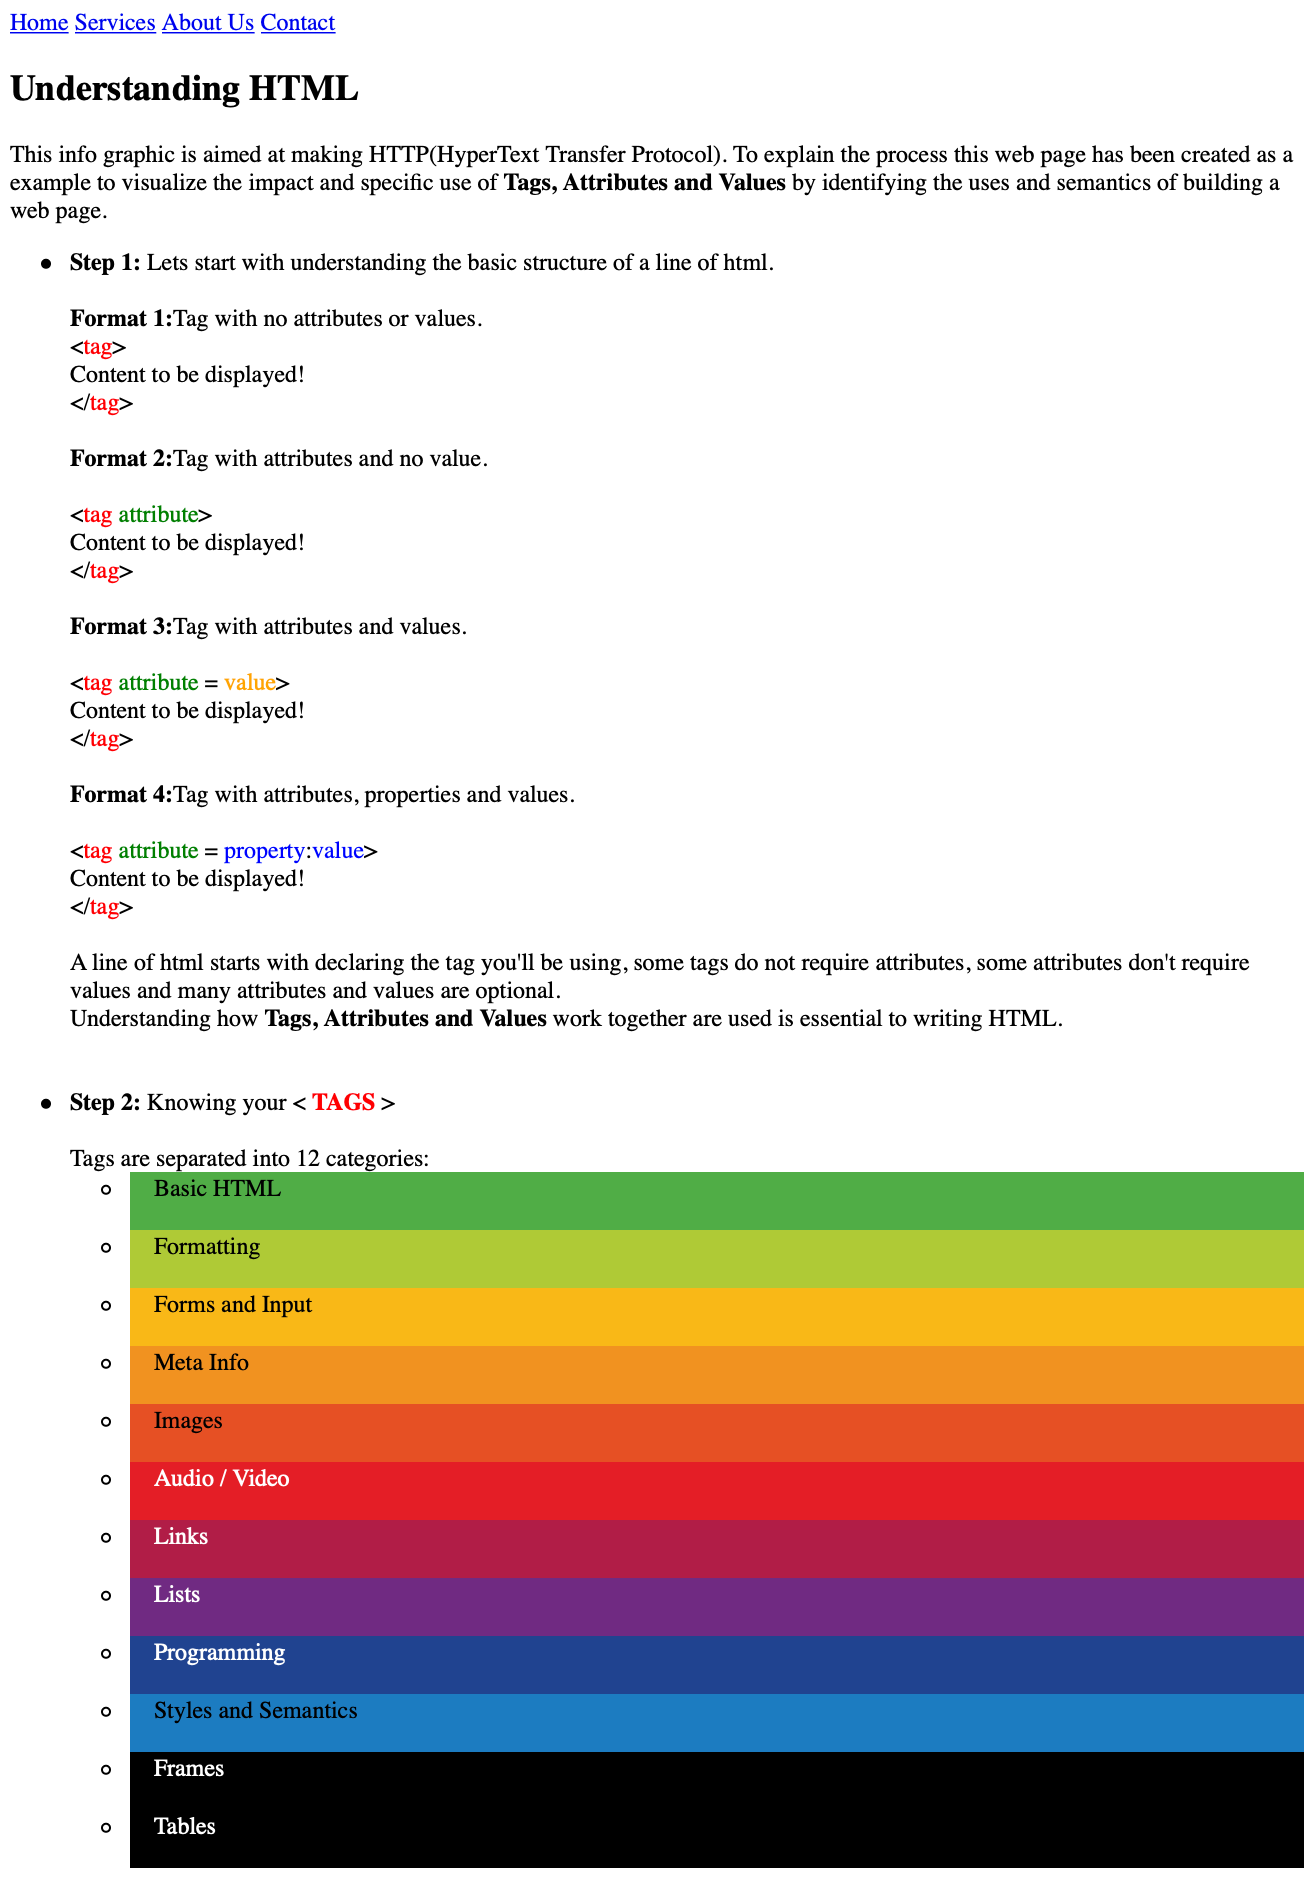
Examples: Code view, Web View
The last portion of the infographic display a two part example/ explanation for the infographic. On the left we see the code view of the display page on the right, this relationship allows for identification of how different elements contribute to the style that is apparent when the page is live. The main goal of these examples is to show the best format for entering your code, and how each tag attribute and value results in the display HTML view. In addition, the web page is an explanation of the infographic itself, this completes the first portion of the visual learning: web design trilogy.